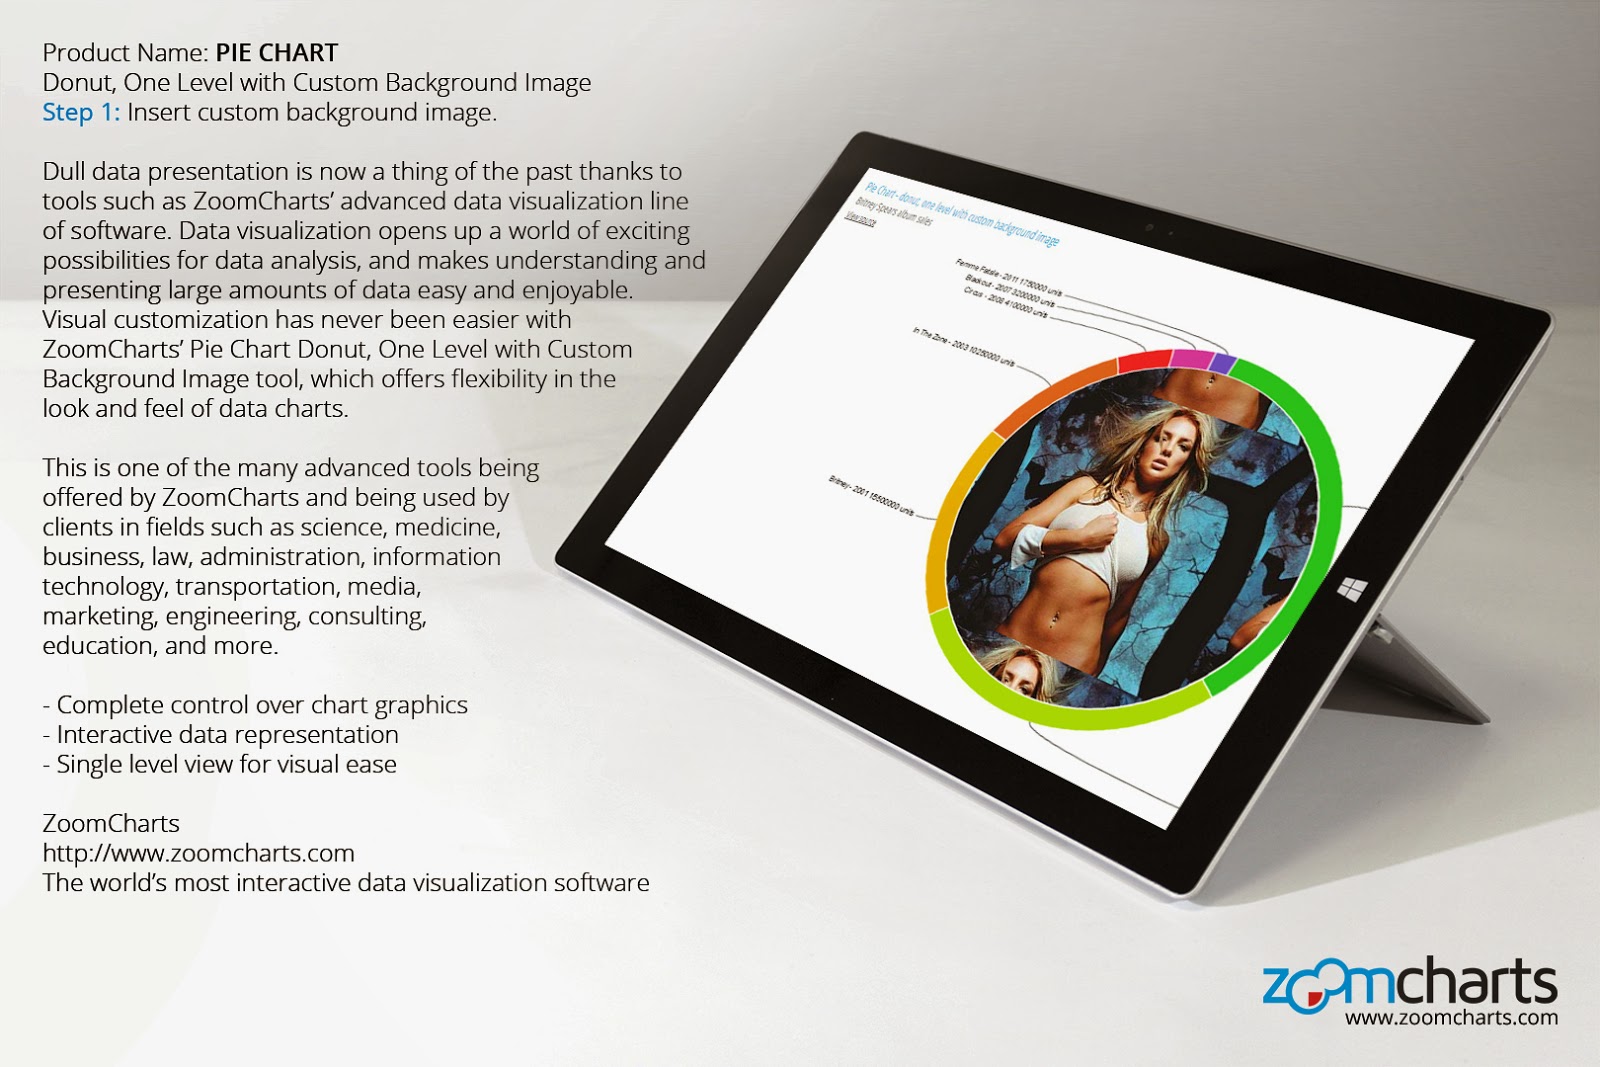
Dull data presentation is now a thing of the past thanks to tools such as ZoomCharts’ advanced data visualization line of software. Data visualization opens up a world of exciting possibilities for data analysis, and makes understanding and presenting large amounts of data easy and enjoyable. Visual customization has never been easier with ZoomCharts’ Pie Chart Donut, One Level with Custom Background Image tool, which offers flexibility in the look and feel of data charts.
This is one of the many advanced tools being offered by ZoomCharts and being used by clients in fields such as science, medicine, business, law, administration, information technology, transportation, media, marketing, engineering, consulting, education, and more.
- Complete control over chart graphics
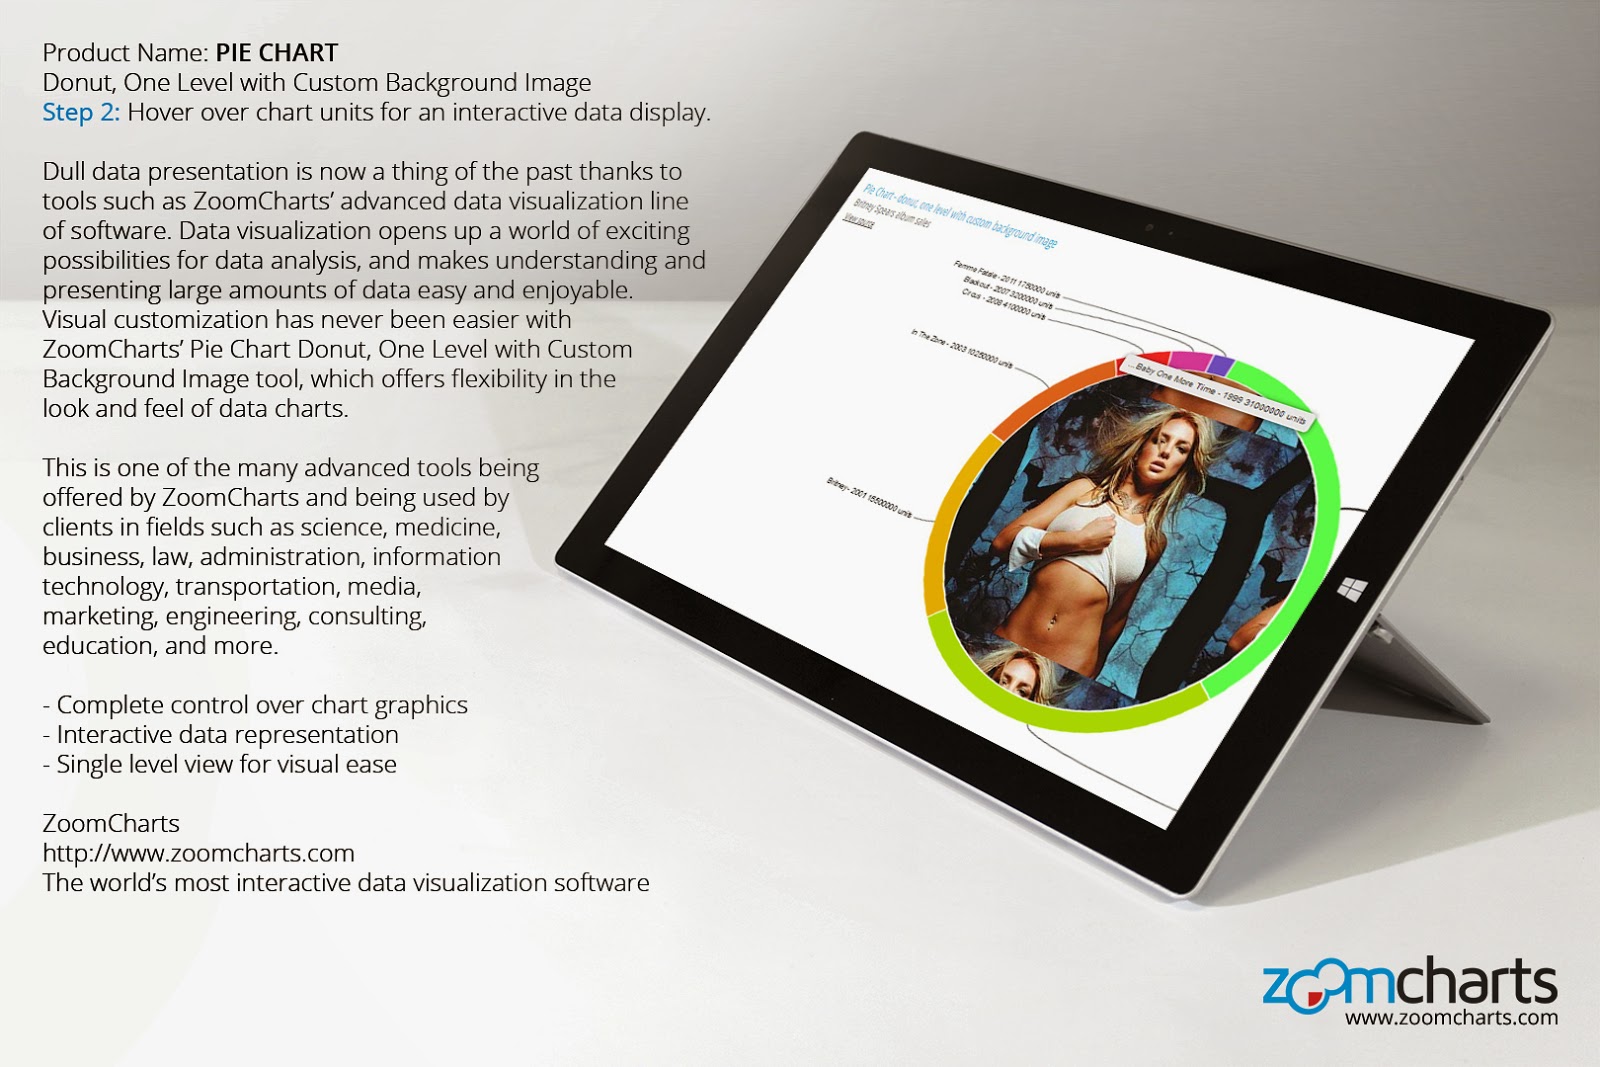
- Interactive data representation
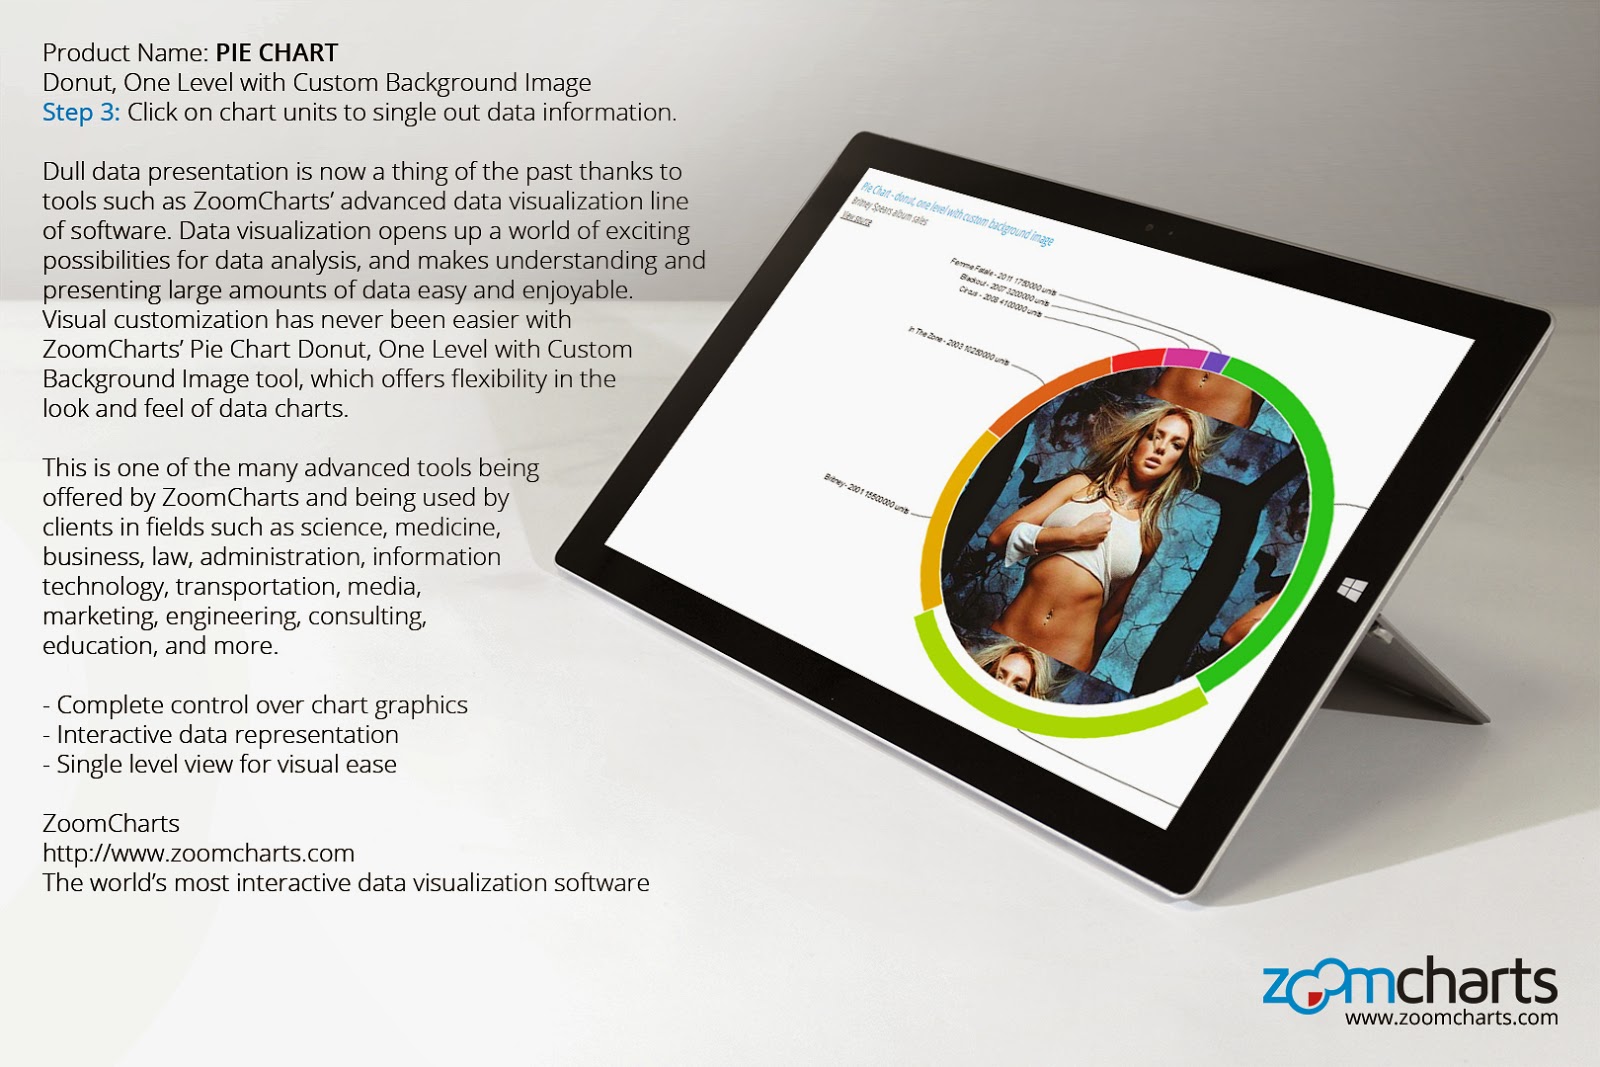
- Single level view for visual ease
Step 1 Insert custom background image.
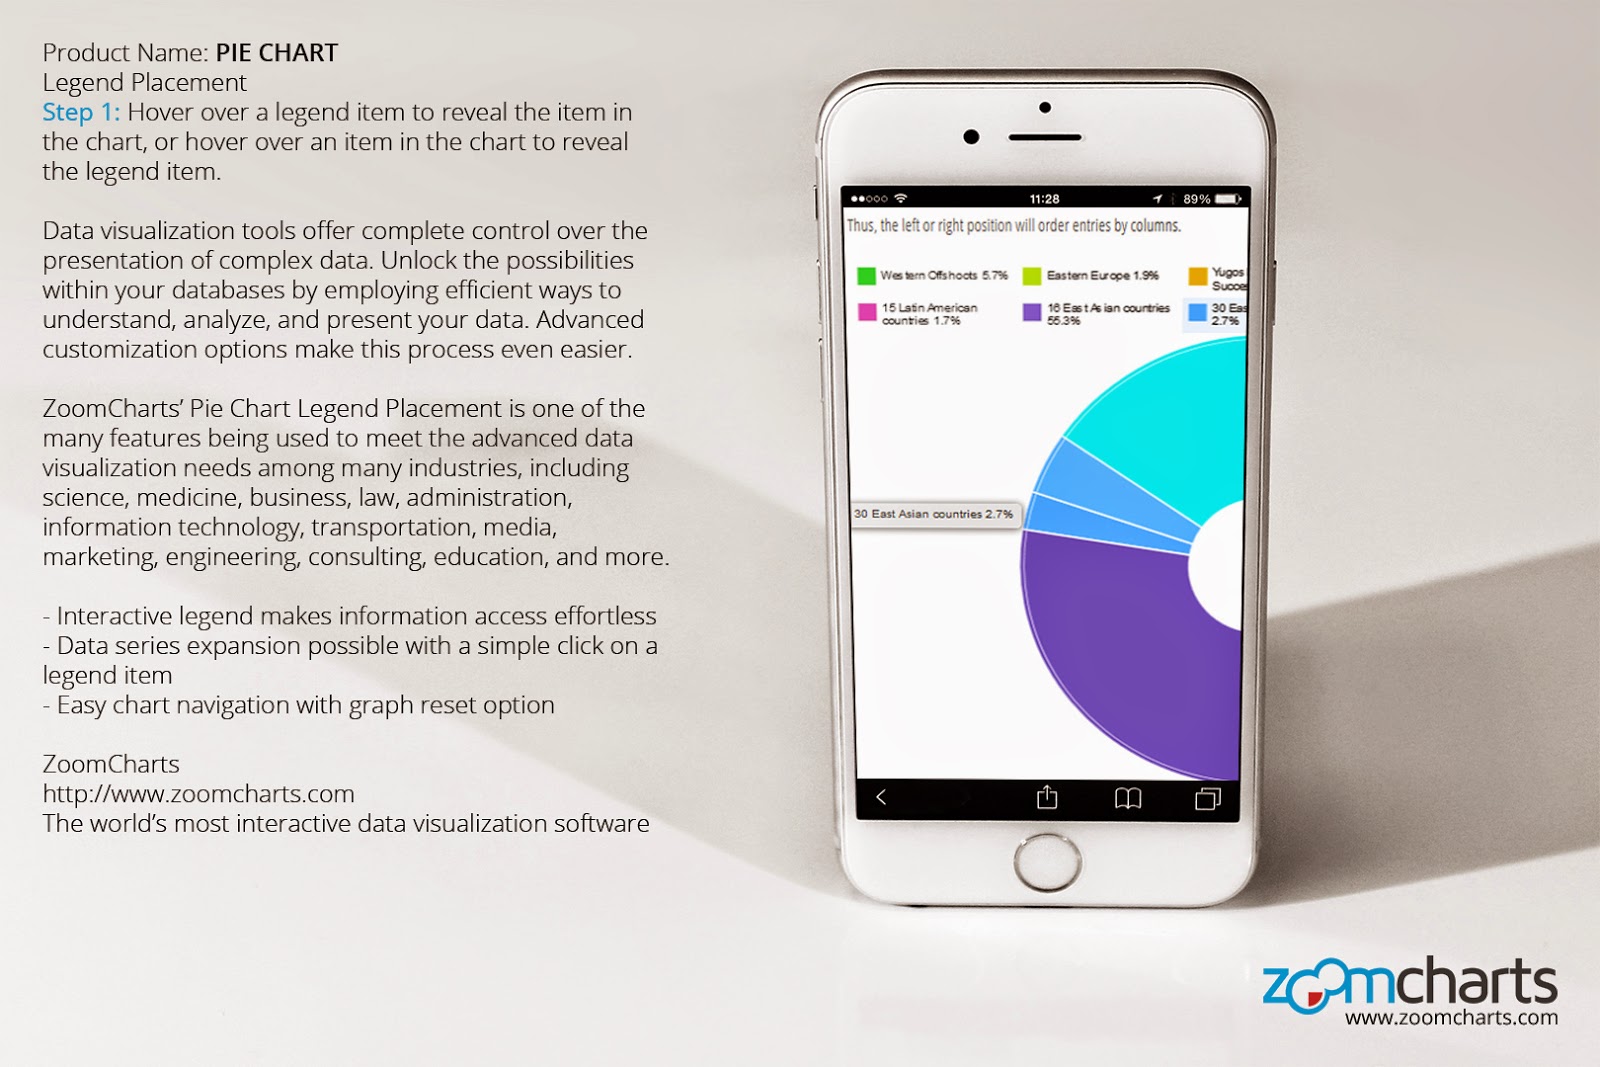
Step 2 Hover over chart units for an interactive data display.
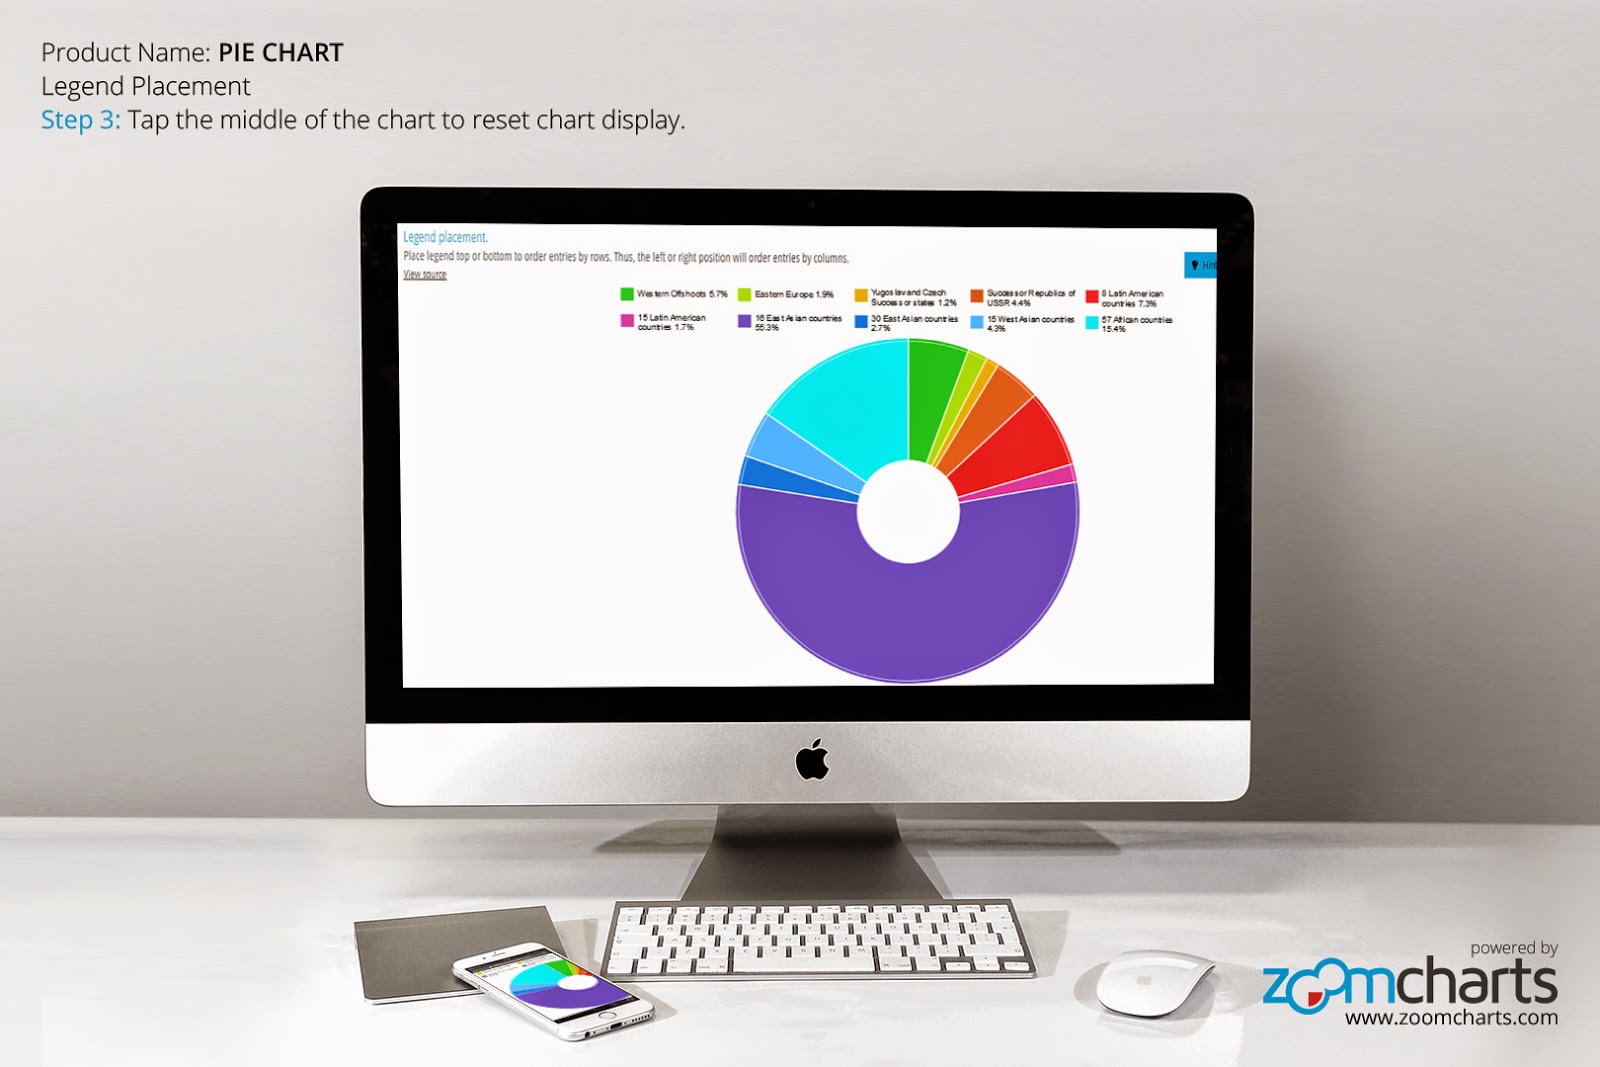
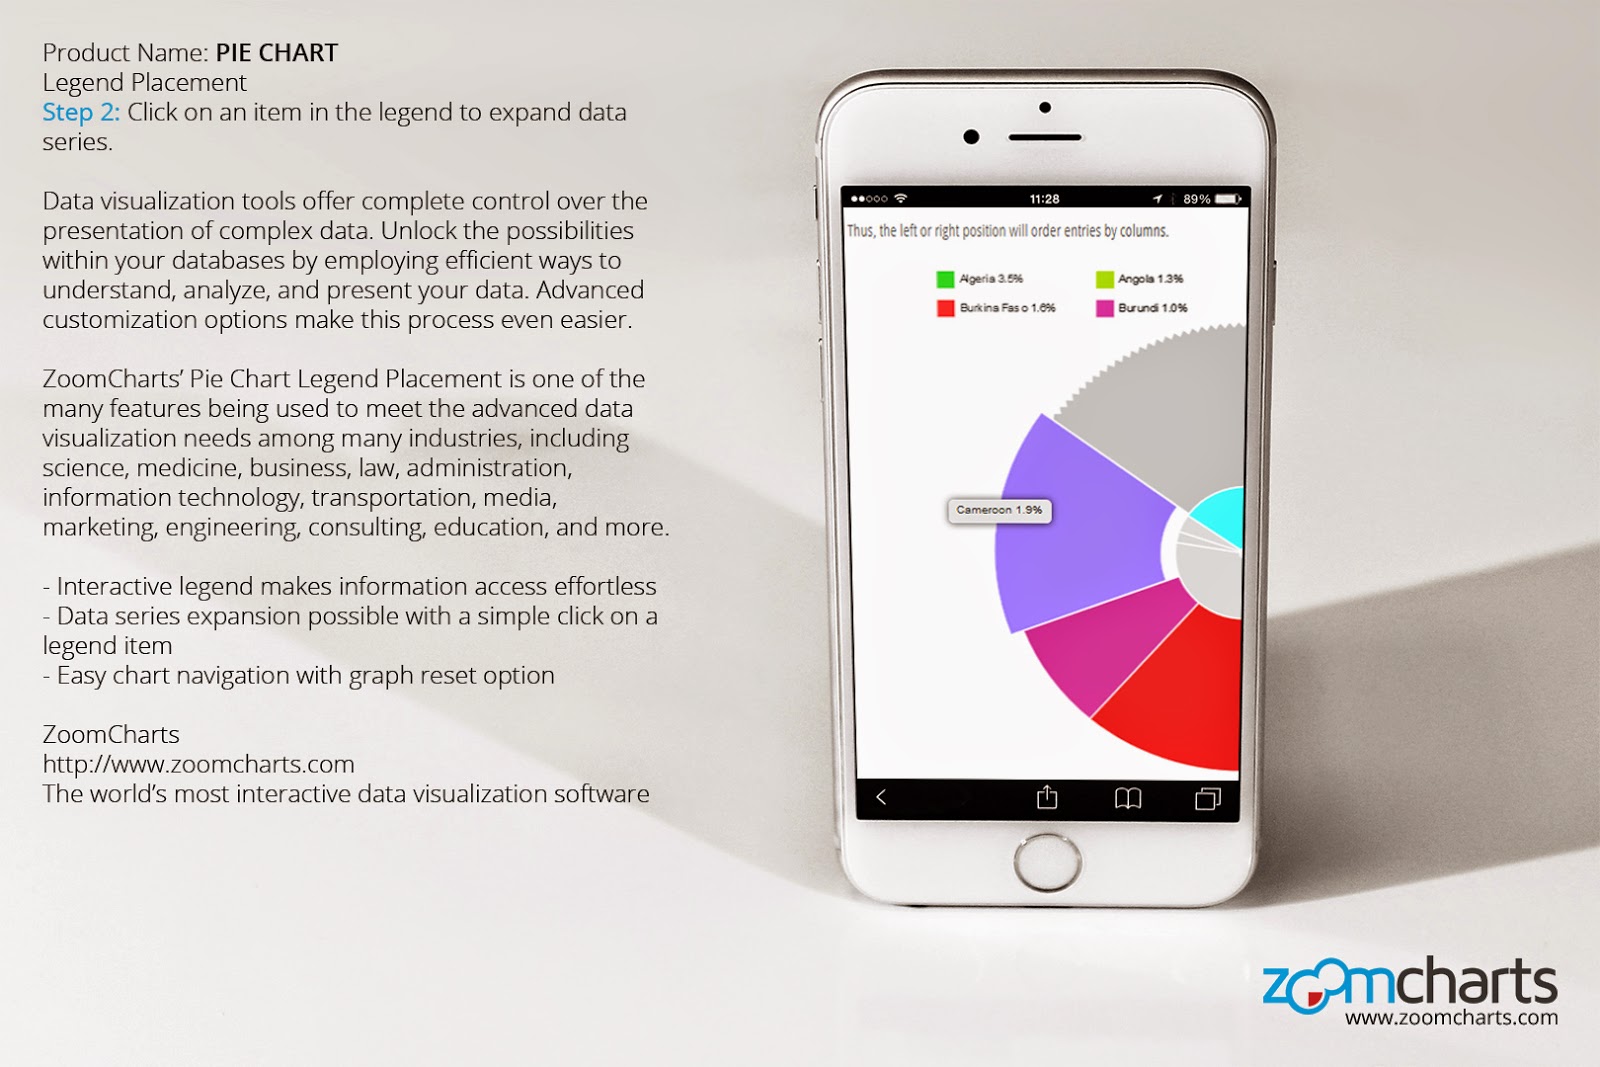
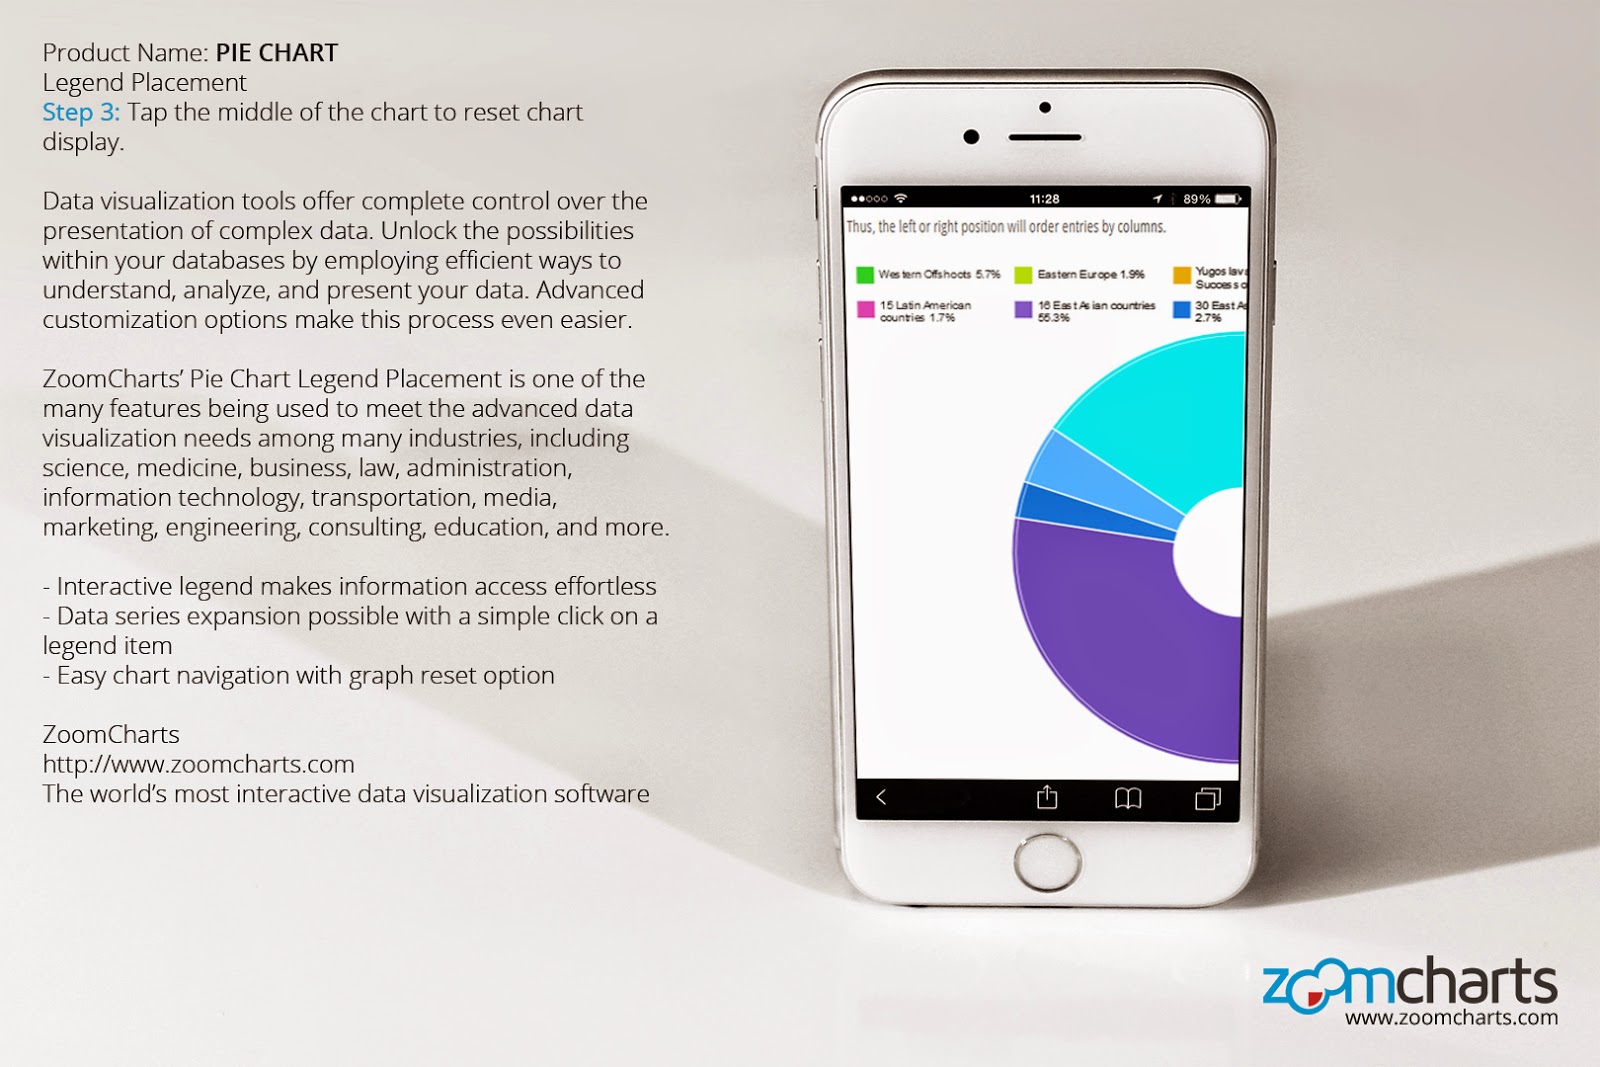
Step 3 Click on chart units to single out data information.
Check out ZoomCharts products:
Network Chart
Big network exploration
Explore linked data sets. Highlight relevant data with dynamic filters and visual styles. Incremental data loading. Exploration with focus nodes.
Time Chart
Time navigation and exploration tool
Browse activity logs, select time ranges. Multiple data series and value axes. Switch between time units.
Pie Chart
Amazingly intuitive hierarchical data exploration
Get quick overview of your data and drill down when necessary. All in a single easy to use chart.
Facet Chart
Scrollable bar chart with drill-down
Compare values side by side and provide easy access to the long tail.
ZoomCharts
http://www.zoomcharts.com
The world’s most interactive data visualization software


.jpg)